Running Online Services at Riot: Part V
In the previous article in this series I discussed the ecosystem of supporting services that allow us to operate micro-services in production. If our micro-services are our carries and those tools are our supports, what about our junglers? That’s where our developer ecosystem for cluster management comes in. In past articles, I’ve talked about some of the tools, like our build farm and our strategy for using containers to build containers, so I’ll avoid going into too much detail about those now.
I concluded the last blog with this little capture of one of our web widgets that helps engineers navigate our ecosystem of tools:
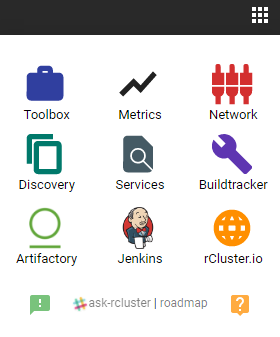
We’ve covered many of these applications: Artifactory by JFrog for image storage and global replication, Discovery for discovery services, Metrics, and Jenkins for our automation and continuous delivery needs. But there are more apps in this image to explore!
I won’t have time to cover everything but this widget is a good place to start. For now I’m going to focus on the tools that help in other key areas of ecosystem management. These tools allow us to:
- Inspect and visualize what’s running on our global container clusters (Toolbox)
- Make it easy to handle complex software networking rules (network.rcluster)
- Query our services at global scale to reason about what is where (Service Discovery)
- Track builds and deployments (Buildtracker)
These tools enable us to deal with dozens of global container clusters and help us manage the sheer sense of scale at Riot. To understand this, the best place to start is with Toolbox.
Managing Clusters Visually
Below is a capture from our container visualizer called Toolbox. In a previous post we discussed our scheduler called Admiral. The image below is a visual result of API data coming from our scheduler. We can see our global cluster presence (count ‘em, 16 clusters!) named by their deployment regions. Riot’s clusters span the globe and can be found in Taipei, Jakarta, Miami, Amsterdam, Korea, and Japan.
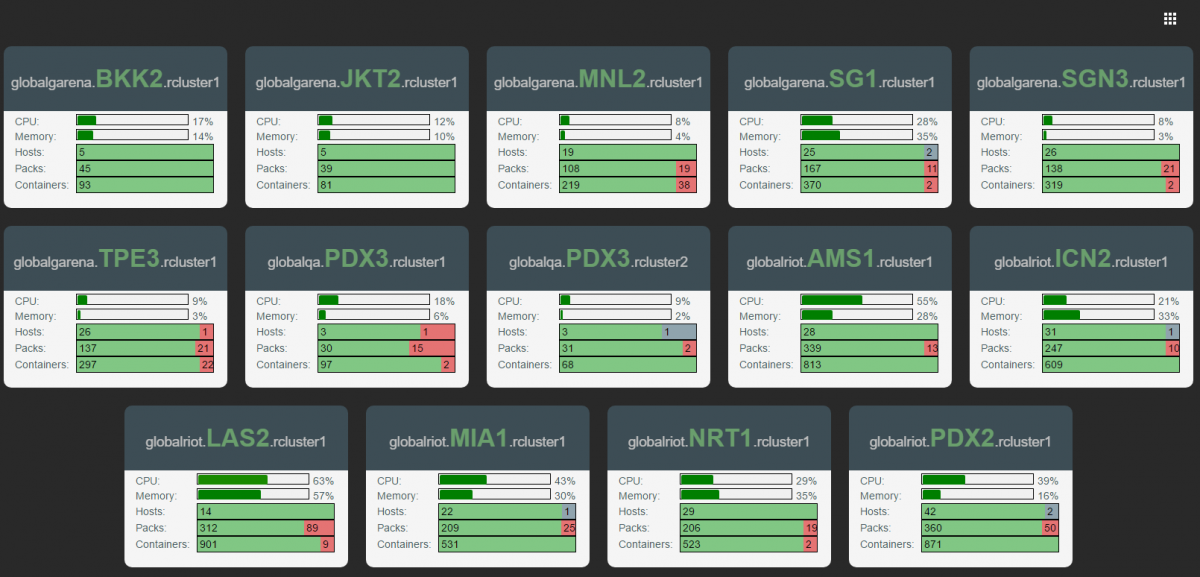
You can see at a glance that we’re running over 2,400 instances of various applications - we call these “packs”. This translates to over 5,000 Docker containers globally. These packs have all become active in the past year or two, because, as I’ve said before Riot builds a lot of software. The capture above doesn’t even represent every service Riot runs, just the ones we choose to run in containers.
Toolbox doesn’t just provide a global view - we can also drill into any data center and see what’s running there.
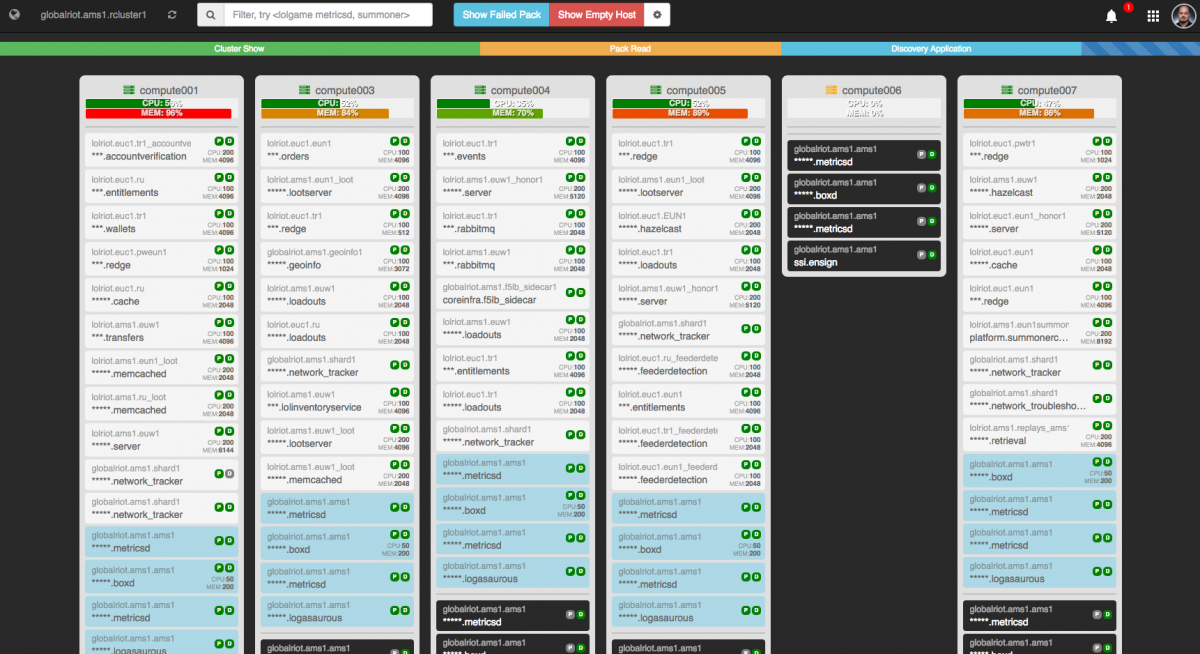
I can’t show you everything in one screenshot, but with this simple view of our Amsterdam system we can see the number of apps running. From here we can view our underlay and overlay services, which are packs designed to make it easy to integrate compute nodes with our scheduler and ecosystem. We can also easily see information like node allocation, status lights for pack health, and which apps are reporting to Discovery. Developers and operators can use this to easily access a global view of how their services are operating.
More details can be found by drilling into a basic service. Let’s take a look at one I help own and operate: the Summoner service. This helps handle Summoner API traffic for Riot services like Chat and the Developer API portal (such as the Third Party Developer API we’ve blogged about in the past).
The namescape and scoping system drives how we handle apps. This is demonstrated in the image below, where Toolbox is filtering by individual app and scope - in this case we’re viewing the application scope “platform.summonercore”. We can see how the app is distributed, including how it uses multiple deployment scopes in AMS1 (I talked about that in our last blog). For example, you can see “lolriot.ams1.rusummoner” and “lolriot.ams1.tr1summoner” which are deployments that support Russia and Turkey accordingly.
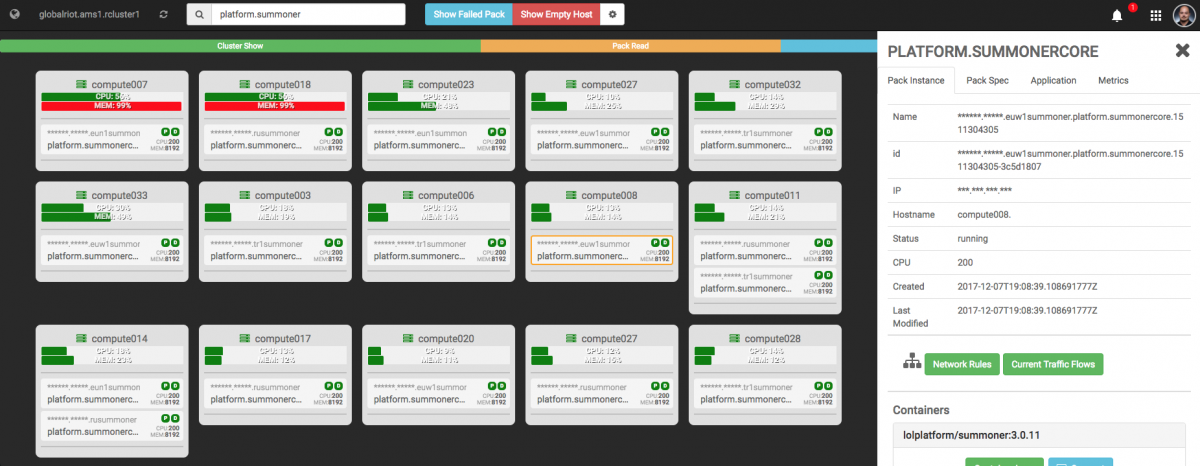
The right sidebar contains additional information such as number of containers in a pack, IP address, basic status, date information, and other detailed bits and bobs. Users can even inspect container logs.
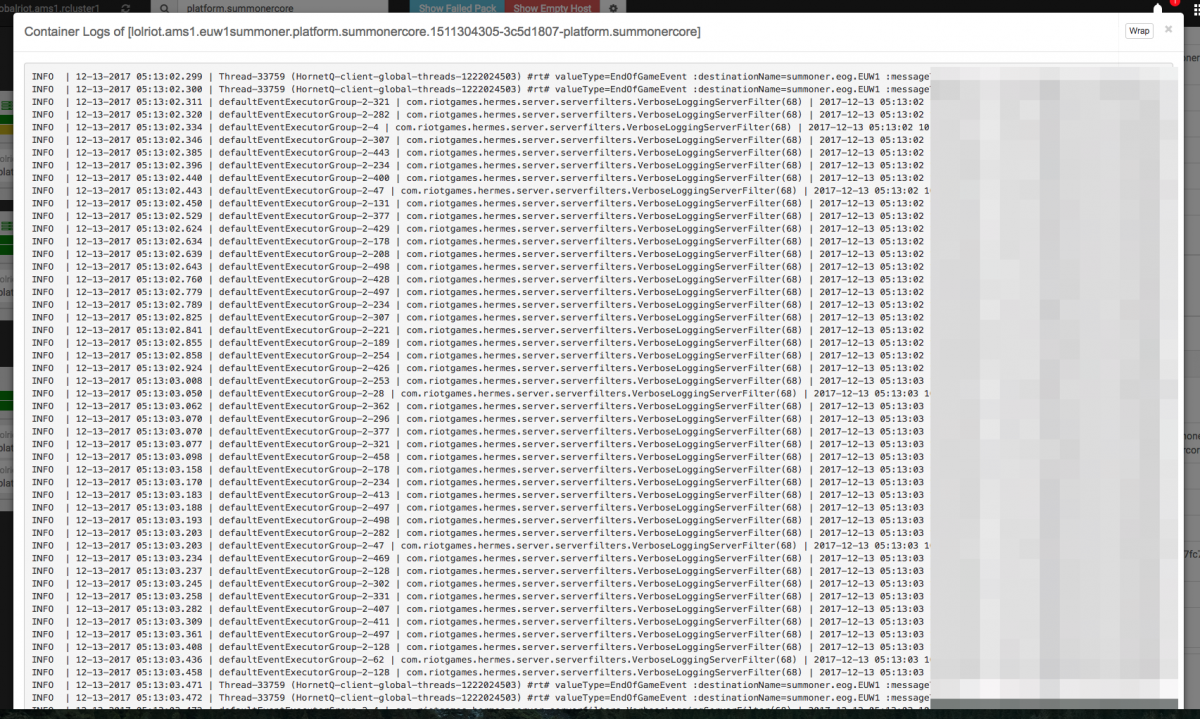
One of my favorite features can be seen in this image. While the logs are loading we embrace our Riotousness with a Dancing Katarina gif. Yes folks, the Dancing Katarina GIF is a meme for us internally - and she turns up in all kinds of internal tool loading screens.
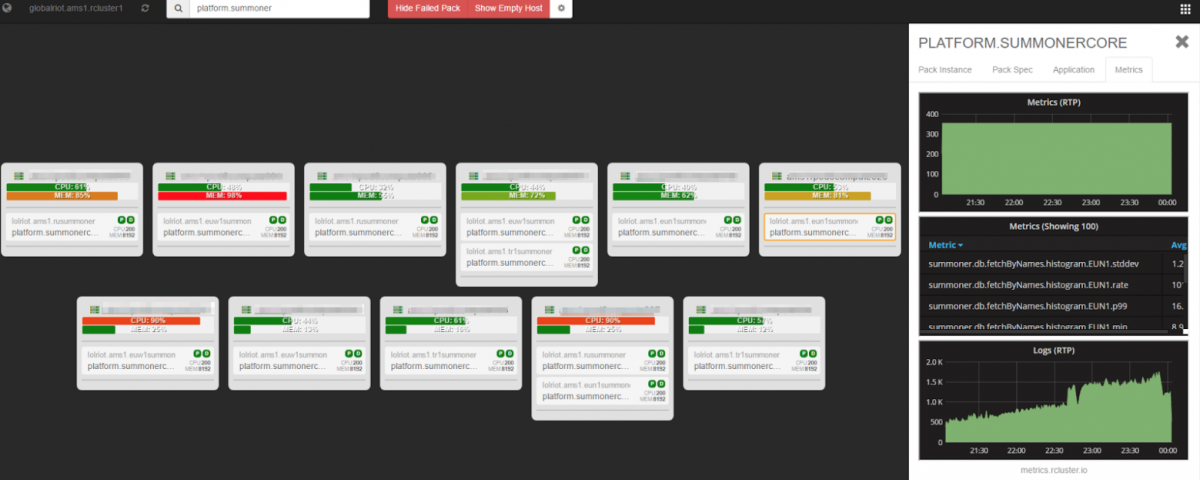
Our metrics system in Toolbox is a one stop shop for core service information, such as service status and location. This system enables us to immediately start triaging if something is wrong. Users can also get snapshots, as shown below.
Managing Complex Network Rules
In a previous blog we talked about how our network is software-controlled with Contrail and JSON configuration files. JSON is cool, but staring at it long enough can make your eyes bleed. To help our engineers out we built a visualizer and chose the very unoriginal name “network.rcluster”.
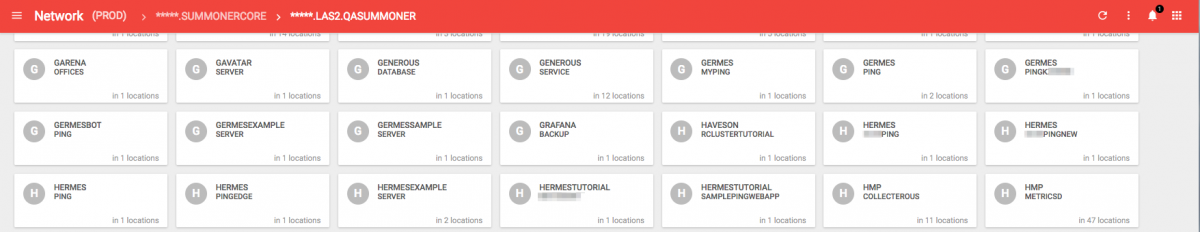
When you log in, you are presented with row upon row of widgets representing networking rules we’ve applied globally across our clusters. Each one of these is backed by a JSON configuration blob. Let’s take a closer look at the app we mentioned before, Summonercore.
At first glance, this isn’t very exciting as it’s just a list of deployment scopes. There’s that application scoping schema again! We can see that Summoner has network rules for a wide range of deployment scopes. This makes sense, considering Summoner runs everywhere we have a League of Legends presence.
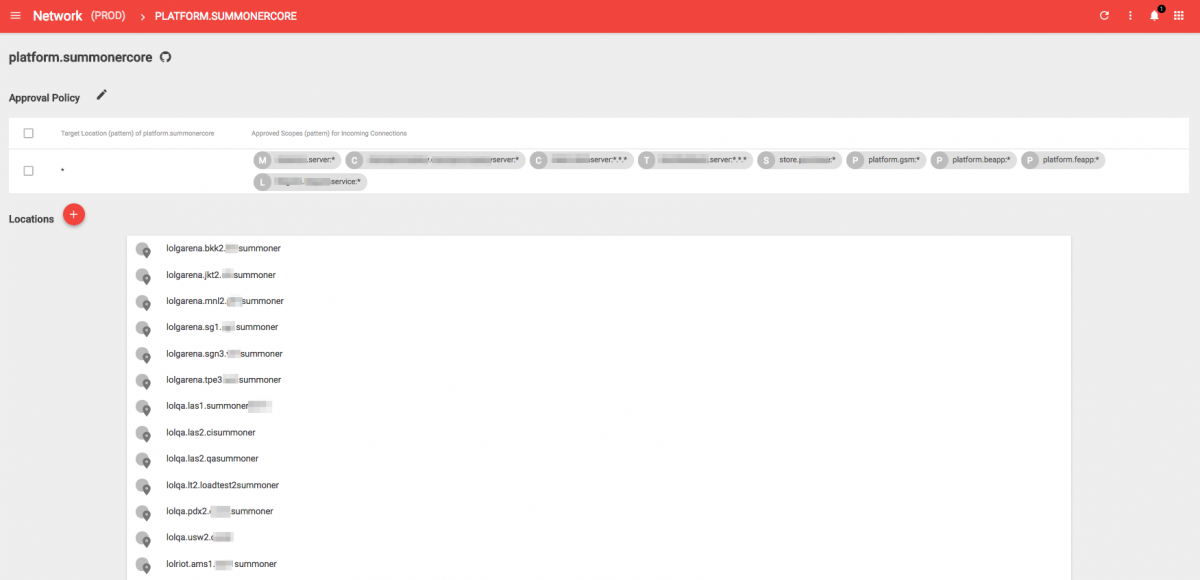
If we pick one of these we should be able to see the Summoner access permissions.
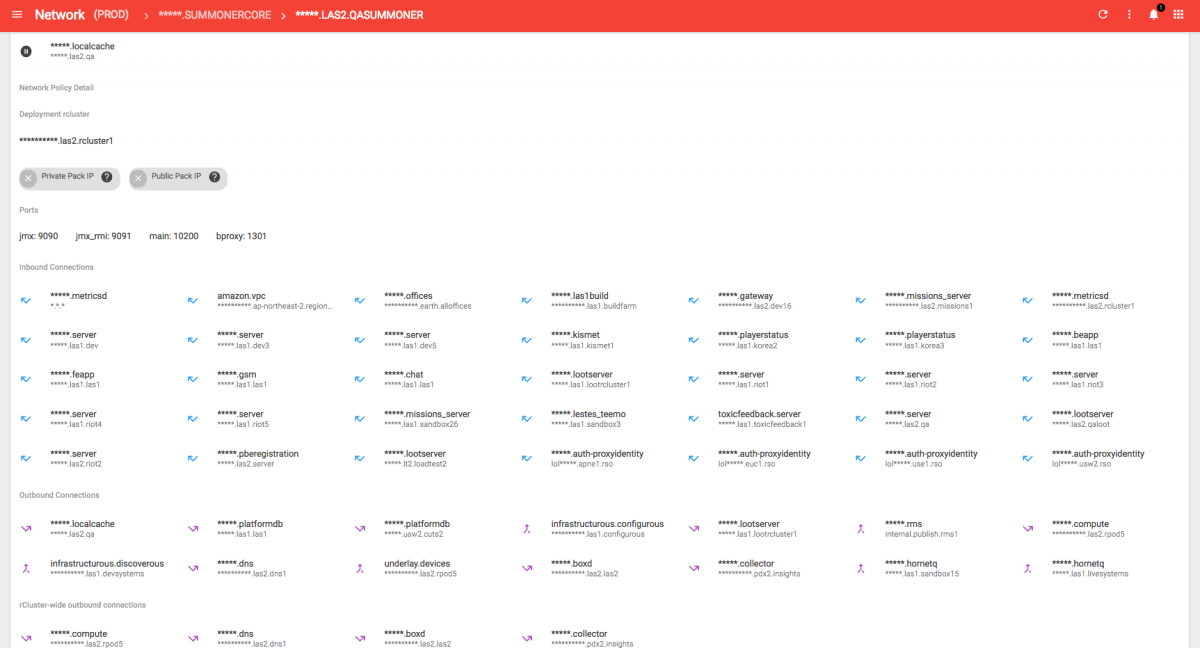
That’s a lot of routes. With this tool, we can inspect the ports we talk on and view all the inbound and outbound connections. And there’s our favorite application scoping scheme again. If you have a sharp eye you’ll spot that Summoner is allowed to talk to our “rtp.collector” which calls back to the metrics I mentioned before. Another connection is “infrastructurous.discoverous” - that’s our discovery service. This particular screen grab is from a QA environment so you can see some test apps. I may or may not have taken the liberty to hide a few things we haven’t announced yet.
Finding Things Globally
One of the challenges of running so much software is that sometimes you lose track of where things are deployed. We can use a tool like Toolbox to manually go through each cluster and filter for the app name, but Toolbox only shows us our running packs and containers. A lot of legacy Riot software is deployed to physical machines (how traditional) and we want the ability to hunt those applications down as well.
That’s where a query service or information aggregator comes in handy. We have our creatively named “services.rcluster” tool, which allows us to specify all kinds of context-based searches. Here’s a capture of me using this tool to find all the global Summoner services that we were just looking at.
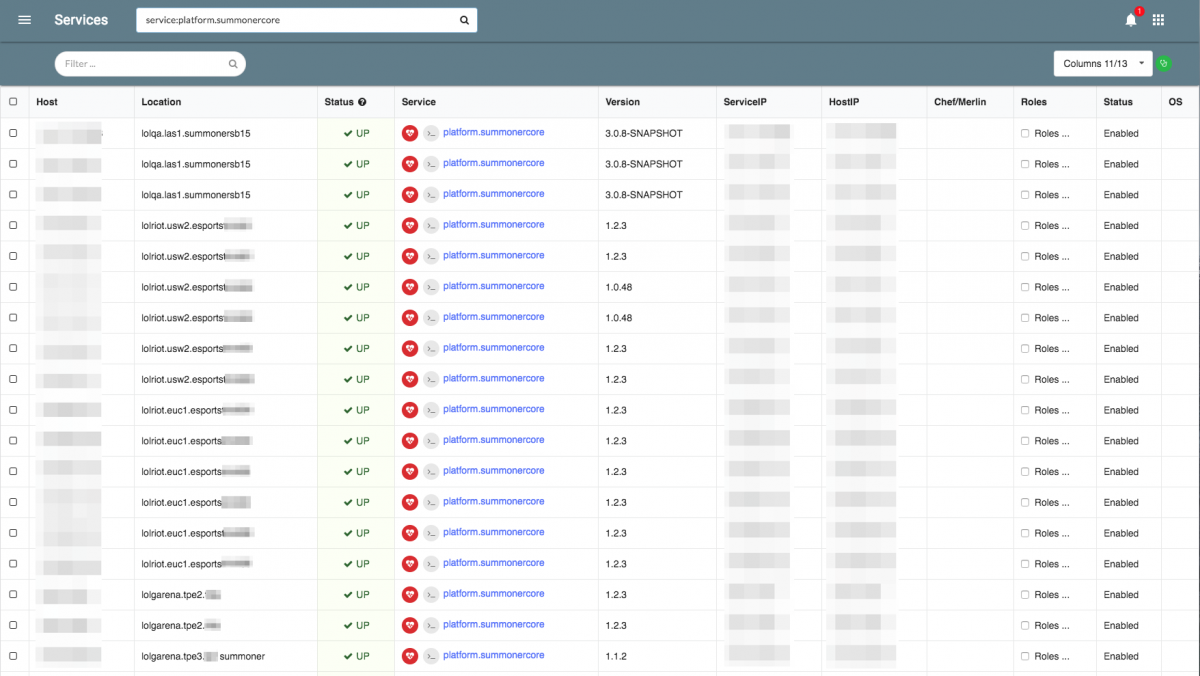
For clarity, the query service is not the same as our Service Discovery tool. Instead, it uses a context-sensitive search to query non-discovery services. For example, it can crawl our Admiral scheduler deploys, matching strings and returning relevant hits when you only remember the string “summoner” in “platform.summonercore”. It’s a human-based search tool and thus accommodates human imperfections.
Even here, you can see the “Location” column that references the deployment part of our naming scope. The service name in the column is the application scope.
Tracking Builds
Until now we’ve looked at how we manage things running in production. But most software lifecycles start long before they reach production. With over a million builds of software a year, we’d be in trouble without the ability to see events over time.
Enter Buildtracker. This tool is another API/web-driven tool where teams can elect to post and query data either during automation or by hand. This allows them to track their software as it transforms from code to service.
I could probably write an entire article on this tool. This is the first time we’re discussing it publicly, but we’ve been using this tool for around 3-4 years - long before we moved to micro-services.
With the sheer amount of software we build and scale, we don’t really want teams to crawl thousands of lines of build and pipeline logs to track their builds. Buildtracker provides a clean API for Continuous Integration systems (or any automation/deploy system) to add, tag, and query any build for its changelist and artifacts.
Our micro-service build pipelines can be generated when a team decides to build a service. Teams can also create their own build pipelines and use this API for tracking. They can then search their builds for results like this:
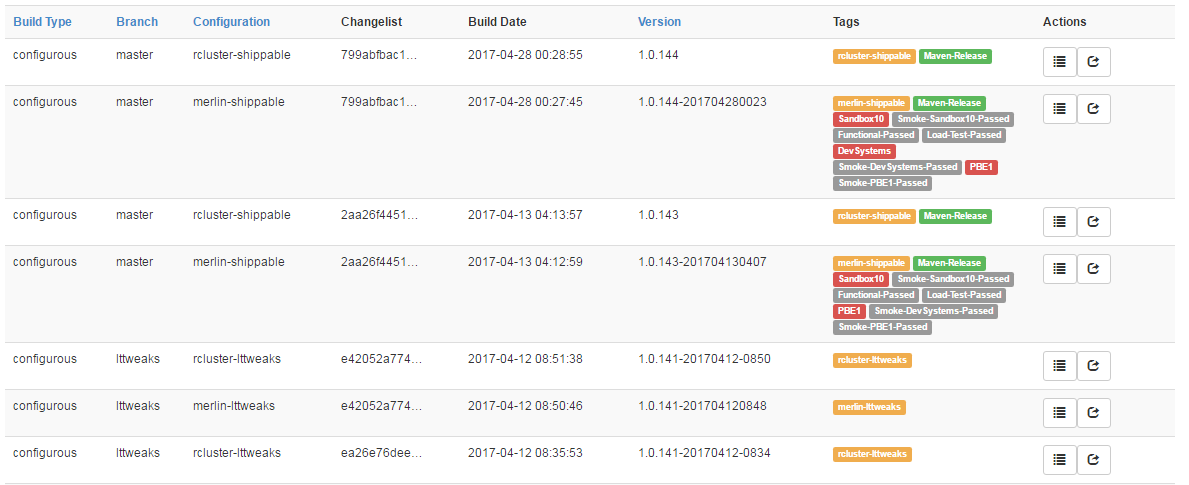
Above is an image of our configuration service entries in Buildtracker. We build different flavors for a number of filters, such as a given changelist, when it was built, the version number it used, and a variety of tags. The tags track several behaviors, including what environments a build artifact was deployed to (in red), and what QA events it passed (in grey). Teams can use Buildtracker tags to mark various builds as “QA Passed”. They can then mark steps that should only retrieve QA Passed builds, like a deploy job. This process allows teams to create trusted Continuous Delivery pipelines that ensure they only deploy items that have passed quality checks.
Even if teams don’t adopt this process fully, they can still have access to a valuable history of what’s happened to the build with at-a-glance references to a host of information and details.
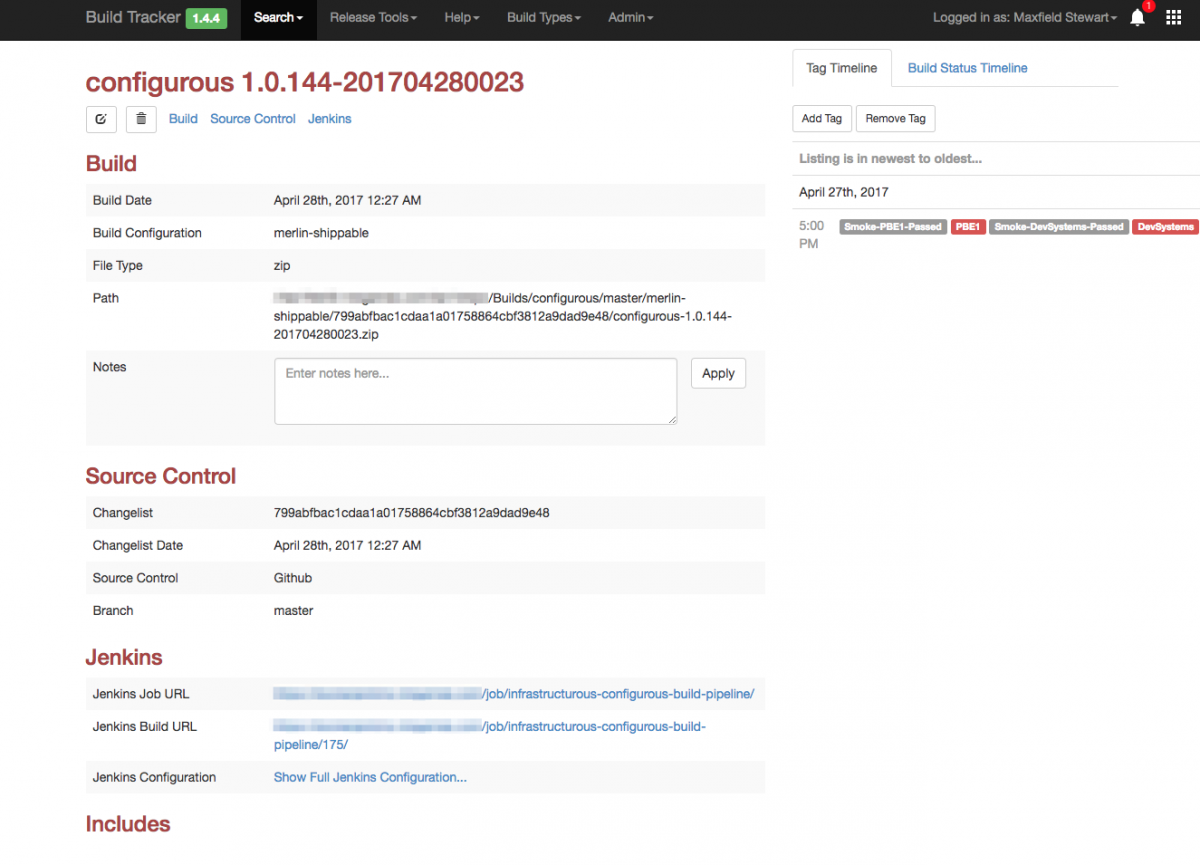
This page contains a path to the artifact store, links to the build jobs, and timelines of various events that occurred. The Release Management view in Buildtracker enables us to see the full power afforded to teams with this kind of metadata:
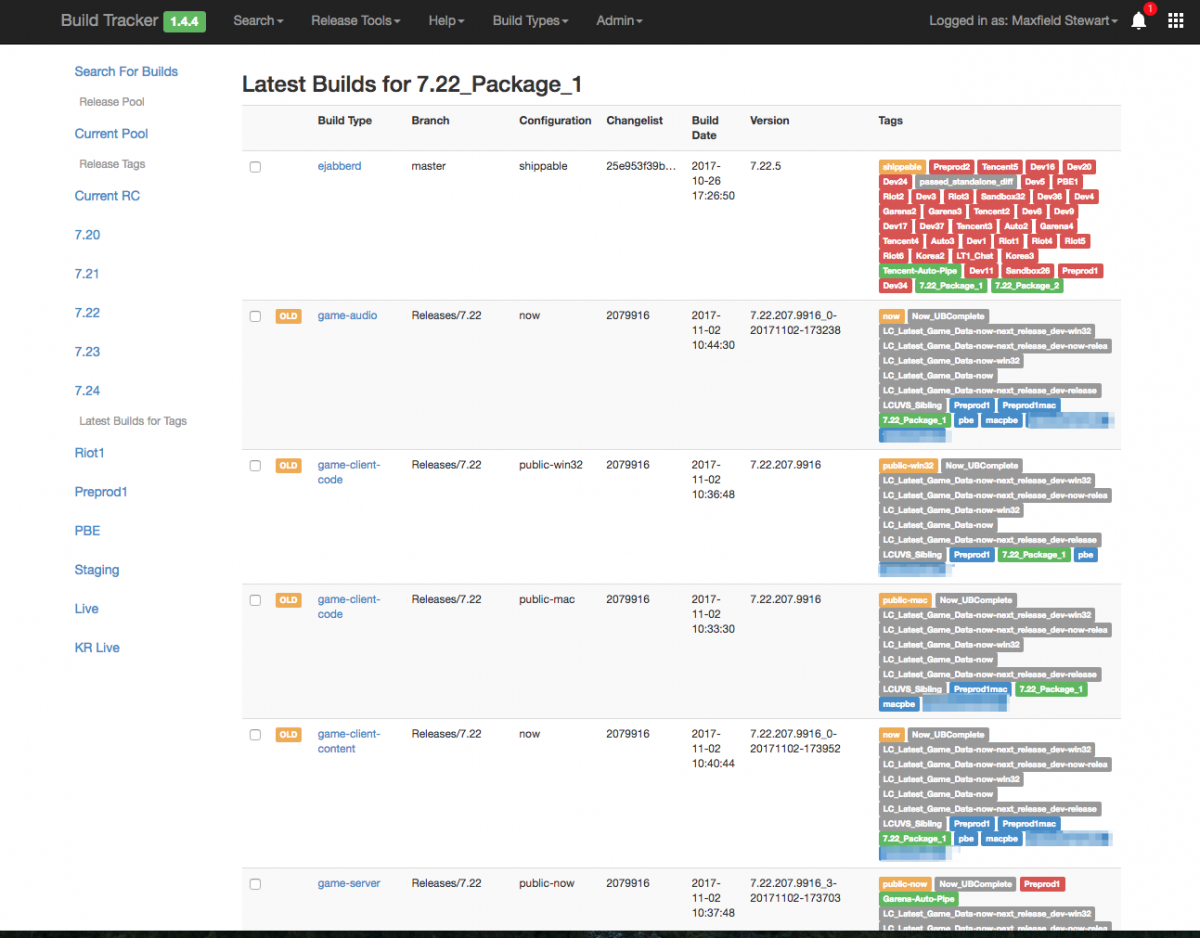
This image is just a snapshot of one of the release team’s buckets for managing League of Legends releases. Clients, game servers, audio packages, and services can be included in these lists. You can also see the dozens of tags reflecting patchlines, environments, QA processes, and more.
When you’re building hundreds of services and applications, having some kind of data aggregator like this really helps make sense of your process and give you some release management control.
Conclusion
Many of the ecosystem tools I present in these articles work automagically for teams. Others are opt-in technologies; teams can choose to use them or do something on their own. Our general strategy is that if the tool and technology are useful enough, teams will use them instead of building their own solutions. This creates a flexible, agile atmosphere that allows us to focus on creating and supporting the most valuable tools we can for the teams that really want or need them. For example, a team may use Service Discovery but choose to statically configure their apps at build time, or never store secrets, or use almost everything we offer but build their own solution for tracking builds.
Ultimately, these tools give each service creator and product team the ability to leverage what they need to ship features to players as quickly as they can while maintaining a high quality bar.
For more information, check out the rest of this series:
Part I: Introduction
Part II: Scheduling
Part III: Networking with OpenContrail and Docker
Part III: Part Deux: Networking with OpenContrail and Docker
Part IV: Dynamic Applications - Micro-Service Ecosystem
Part V: Dynamic Applications - Developer Ecosystem (this article)
Part VI: Products, Not Services