
The Riot Games API: Fulfilling Zuul's Destiny
This article is the third in a multi-part series on the Riot Games API. As discussed in our second article, the API is fronted by the Zuul proxy server developed by Netflix. We chose Zuul because Netflix built it to handle an enormous amount of daily traffic, so we knew we could trust that the code was battle-tested and production-hardened. However, since we first launched the API over 2 years ago, we struggled to get the expected load capacity out of our Zuul instances, although we knew the problem couldn’t possibly be with Zuul itself.
In this article, I will outline how we tracked down a number of configuration issues affecting the capacity of our boxes, the network, and Jetty. First, I will cover some issues with socket management that were causing bottlenecks. Next, I will discuss another manifestation of what seemed to be the same socket problem with the same symptoms and how we resolved it. Last, I will walk through our understanding of the issues that had been affecting us, how they all tied together, and where we’re at now with our capacity.
Capacity Problems
When we first launched the API, our deployed Zuul instances were able to handle about 10K requests per minute (RPM) each before falling over (more on that later). We didn’t have a lot of insight into the expected capacity, but the low RPMs we were able to eek out was always a point of concern and confusion given how effectively Zuul works for Netflix’s large traffic volume. Throughout the lifetime of the API platform, we saw troubling patterns of behavior where exceeding certain RPMs or slow proxied requests would cause Zuul instances to become unresponsive. When our Zuul instances are unresponsive, API calls fail, which affects 3rd parties that use our API. Highly trafficked sites, like OP.GG, do caching on their end so that when the API is down, they can still function, albeit with stale data. However, many sites are unable to provide certain features or function at all if the API platform is unresponsive. Thus, finding and fixing these types of issues with the API platform has always been of utmost importance.
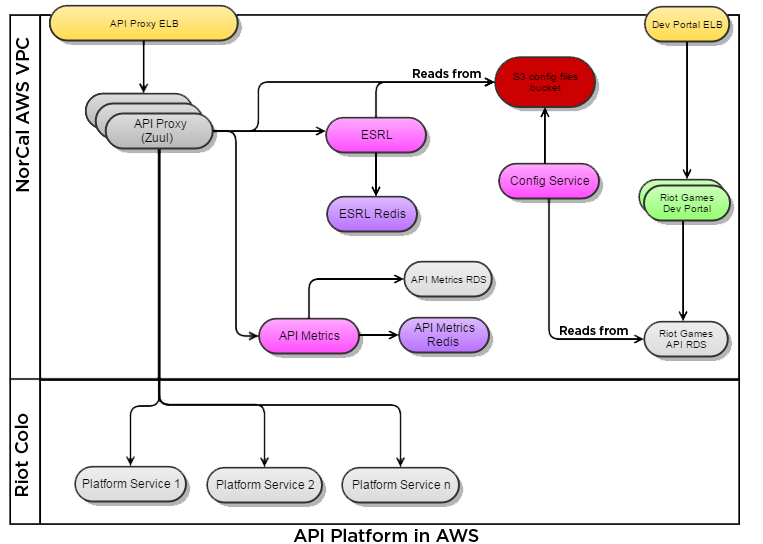
Throughout this article we will be discussing parts of the API infrastructure and Riot network. The following diagram will aid in visualizing how they interact as you read.
Socket Management
Shortly after launching the API, we noticed a pattern of behavior where over the course of a few hours, Zuul would become very slow and stop responding to calls, and would then recover on its own. Usually after a day or so of the oscillating pattern, the issue would resolve on its own entirely before reappearing months later.
The first time we saw the behavior, investigation revealed that requests were taking an abnormally long time to process. Eventually, the slow requests occupied all the Jetty worker threads and any additional incoming requests piled up in the Jetty accept queue. The accept queue grew large enough that requests sitting in the queue eventually timed out while waiting to be serviced by a worker thread. After enough requests were rejected from the accept queue without being processed, the slowness would clear up and requests were processed in a timely manner again. Then, after a few hours, the pattern began anew.
After seeing this cycle for a few times, we determined that a slow response from a proxied service was one potential culprit. If enough of the traffic through Zuul was proxied to that service, it would trigger the downward spiral and take down the entire edge. To mitigate this risk, we added the ability to configure connect and read timeouts, which allowed us to fine tune values for each proxied service and protect the system from consistently slow services.
Even with that fix in place and confirmed working as intended, the behavior eventually cropped up again. Another investigation revealed that numerous sockets on the boxes were in the CLOSE_WAIT state when Zuul started slowing down. We saw a clear pattern of slowness once the number of sockets in CLOSE_WAIT state surpassed several thousand. While there was clearly an issue with sockets not being cleaned up properly, theoretically, the box should be able to handle significantly more sockets than were being consumed without a performance hit. The pattern was so predictable, that we wrote a script to reboot Jetty if the number of open sockets on the machine ever exceeded 4000 ‒ a bandaid solution to make due until we could find and fix the socket leak.
Eventually, we found code that wasn’t properly cleaning up the connection when a request timed out, and deployed a fix for it, which resolved the immediate issue. Yet only months after deploying that fix, the dreaded behavior returned. This time, there were no sockets in the CLOSE_WAIT state, but the pattern was identical to the previous incarnations and we did see spikes of open sockets. We decided to increase the number of open sockets the instances would allow and increase our Jetty thread pool size, as follows.
Added to /etc/sysctl.conf:
# increase max open files
fs.file-max = 65536
Added to /etc/security/limits.conf:
*               soft    nproc           65535
*               hard    nproc           65535
*               soft    nofile          65535
*               hard    nofile          65535
Added to /usr/share/jetty/start.ini:
#increase thread pool size
threadPool.minThreads = 50
We didn’t see any improvement from these changes. At that point, at a loss for what else to try, we added some more instances of Zuul to our cluster and the issue resolved itself. For a while, we added new instances whenever our average throughput increased enough that the RPM for the instances consistently exceeded the 10K RPM mark, which generally coincided with the behavior reappearing. The new instances always resolved it.
Same Pattern, Different Reasons
In March, we reworked Zuul to use Hermes client ‒ a home-grown framework that I discussed in my previous article ‒ instead of Ribbon for client-side software load balancing across a set of endpoints. At the same time, we refactored a number of our other infrastructure pieces from dropwizard applications to Hermes server applications. We had been testing all of these changes in QA and staging environments for months. During the week starting April 11, 2016 we performed a series of rollouts to deploy the new artifacts into production across all of our VPCs, including Zuul, ESRL, API Metrics, and Configuration Service.
On 4/16 around noon, Zuul started showing that same old pattern. At first, we spent some time trying to figure out which of our many changes could have resurrected the pattern, but nothing was standing out as a glaring culprit. From there, it seemed obvious what we should check next. Sure enough, when the Zuul instances were being unresponsive, the number of open sockets on the boxes was over 12K. As before, we felt the box should be able to handle that number of open sockets without issue, but historically we had seen that it couldn’t. We wondered if our traffic had hit the 10K RPM per box threshold again, causing the behavior to return. We checked our New Relic monitoring and determined that our traffic had not increased over the past few months, so we ruled that out, even though the symptom of having a large number of open sockets was similar.
Our New Relic monitoring also confirmed there were no issues with memory health in the JVM on any of the boxes. We did notice that affected boxes were always in us-west-1a, but we weren’t sure if that was a coincidence. We also noticed that our boxes were not all on the same kernel version. In the past, we have seen issues caused by kernel changes. For example, after one kernel update, TTL for packets changed, causing some packets to be dropped and blocking our proxied calls to certain underlying services. Just to make sure that any interaction with the kernel or any other software was consistent across all of our boxes, we did a yum update on all the boxes and restarted them, but we saw no change in behavior. We also did some testing while the Zuul instances were unresponsive to see if there was some sort of ping spike or latency issue to the DC happening at those times, but that didn’t seem to be the case.
Having ruled out other options, we went back to the large number of open sockets. While we still felt the boxes should be able to handle a few thousands open sockets, we knew that symptom had always been associated with this same behavior in the past. One of our newer team members, who hadn’t been around for previous incarnations of this issue, looked at how we had the OS socket settings configured and suggested the following changes.
Added to /etc/sysctl.conf:
# increase max open files
fs.file-max = 1000000
# increase the port range (to allow more sockets to be opened)
net.ipv4.ip_local_port_range = 9000 65535
# allows OS to reuse sockets in TIME_WAIT state for new connections when it is safe from a protocol viewpoint.
net.ipv4.tcp_fin_timeout = 15
net.ipv4.tcp_tw_reuse = 1
net.ipv4.tcp_tw_recycle = 1
Added to /etc/security/limits.conf:
*               soft    nproc           1000000
*               hard    nproc           1000000
*               soft    nofile          1000000
*               hard    nofile          1000000
Added to /etc/pam.d/su:
session required pam_limits.soWhile we weren’t sure whether the build up of open sockets was a cause or a symptom, we decided to go ahead and make these changes. They seemed like beneficial changes regardless and we were curious to see if they would help. However, the behavior persisted.
We continued our investigations and used JVisualVM to watch the worker threads exposed via JMX/MBeans, which revealed something surprising. While we thought our worker threads were being set to a max of 2000, JVisualVM showed the max set to 200. We did some digging and discovered that the min and max threads also get set in the default /usr/share/jetty/etc/jetty.xml, which overrides the settings we had put in start.ini. We made a change to set the values in jetty.xml and restarted the Zuul instances.
Added to /usr/share/jetty/etc/jetty.xml:
<Set name="minThreads" type="int"><Property name="jetty.threadPool.minThreads" deprecated="threads.min" default="10"/></Set>
<Set name="maxThreads" type="int"><Property name="jetty.threadPool.maxThreads" deprecated="threads.max" default="2000"/></Set>
We still didn’t see a change in the behavior.
DDoS Protection and the Edge
We knew there had to be a solution. We continued investigating and finally traced the problem back to our proxied calls to the spectator service. Tens of thousands of requests were being made to the spectator service per day (67K RPM over 24 hours, a third of the total traffic). We reviewed the response times of the spectator service during the periods when the Zuul instances were unresponsive, and found a direct correlation. The spectator service requests were taking very long, often 3 seconds and even as high as 40 seconds in some cases. Thousands of requests that took 3 or more seconds to complete were clogging up the available worker thread queue. Thus thousands of other requests, including health checks, were being timed out by Jetty after 30 seconds. The failing health checks caused a cluster-wide oscillation of up-and-down behaviour. Failing health checks would cause all the endpoints for a service to be removed. Then, when the health check for a single instance would pass and the ELB re-added it, that instance would tank all of the load for that service, and immediately fail. The temporary solution was to disable the spectator service endpoints, causing Zuul to think the endpoints were no longer valid and immediately return a 503 for those requests. That would eliminate the slow calls, letting health checks through again, and allow the cluster to recover. Once the endpoints were disabled, the cluster immediately returned to and remained in a healthy state. This led us to wonder why the code we had added years before to timeout a service that was being slow wasn’t being triggered. When we looked at the transactions for slow calls from Zuul to the spectator service endpoints in New Relic, it showed that the HTTP client call was taking longer than the configured 1 second timeout, as shown below.
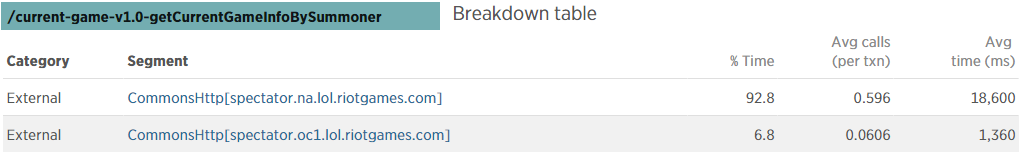
We didn’t know why our configured timeout wasn’t being respected, but we stayed focused on figuring out why the spectator requests were slow to try to get a resolution as quickly as possible. While troubleshooting, we noticed that all outbound requests from an availability zone use the same IP. Throughout our infrastructure, we employ best practices to protect services and so we began to triage internally with other teams to see if our Zuul instances were hitting one of these limits. It turns out that our traffic matched some of the defensive checks, so no new requests could make it through to the spectator service, resulting in the Zuul instances becoming unresponsive. Once our Zuul instances stopped responding to requests, due to the spectator requests slowly timing out and backed up request queues, they started recovering on their own. Our defensive checks would fall off while the Zuul instances were unresponsive, and spectator requests coming into Zuul would once again be serviced in a timely manner. As traffic cycled through this pattern, we would see the health of our Zuul instances go up and down. With some further internal tweaks, we permanently fixed the issue on our end and our Zuul instances recovered and remained healthy.
Achieving Stability
Once Riot Direct added our IPs to their white list, we decided to slam one of our production Zuul instances with spectator service requests to ensure that the issue was resolved. We knew that the other fifteen Zuul instances would be able to handle the load even if we took down the Zuul we were using for the load test. We found that no matter how much load we threw at it, it kept going with no issues, eventually handling more RPMs than ever before on a single box. We managed to get all traffic to the NorCal VPC, which handles about 150K RPM ‒ 50% of our total API load for all regions ‒ running reliably on one 8-core instance. Before that, NorCal traffic had been running against sixteen 4-core boxes running with 4G of heap space.
We knew that we had finally found the stability we had been chasing for years and it was time to start fresh. We spun up all new boxes for our Zuul instances in every VPC to ensure that we had no snowflakes from any of the inline changes we had made on boxes or in JMX while investigating and testing. We went with c4.xlarge (4 core) boxes and 6G of heap for each Jetty process. We put two boxes in each availability zone, which means we now have 4 boxes per VPC, for 12 boxes globally. Before, we were using 30 boxes globally to support our traffic. Since we saw such good results with the OS socket setting changes on the Zuul boxes, we made the same changes to the ESRL and metrics boxes to help optimize their throughput, since all requests to Zuul result in calls to these services. In the months since, we have not had any major issues and the Jetty worker thread pool hovers around 40 busy threads.
In a last twist, as I was finalizing the wording for this article, I accidentally ran into the old issue of our configured timeout not being respected. I was trying to hit a test service through a locally running Zuul and forgot to set up access, so my local Zuul couldn’t reach the service. Instead of the configured 1 second, the request took 3 minutes to timeout. Now that we weren’t in a situation where we were scrambling to restore live service, I decided to take a pass at figuring out why. It took a few hours of investigation and digging, but I finally found the root cause. Hermes sets PROPERTY_READ_TIMEOUT (the socket timeout) and PROPERTY_CONNECT_TIMEOUT (the connection timeout) in Jersey’s ClientConfig, for it to use when configuring the chosen client implementation. I found that while Jersey copies the former property over to the proper value in the Apache HttpParams object in its Apache client implementation, it does not copy the latter. Thus, Apache uses the default value of 0, which means wait indefinitely. The PROPERTY_CONNECT_TIMEOUT is used by Jersey in some of its other client implementations, but not the Apache one. Hermes was delegating to Jersey the responsibility of setting up the right values for the Apache Http Client, but Jersey only does so for the socket timeout. I committed a fix to the HermesClient to explicitly set that value in the HttpParams object, instead of relying on Jersey as an intermediary. I have confirmed that with the fix in place, the configured timeout to an unreachable service is now respected.
Conclusions
We estimate that the change from 30 to 12 boxes will save us about $25,000/year. More importantly, we have finally been able to get Zuul to handle the sort of load that we always knew it should be capable of handling, but never could explain why it didn’t. Netflix uses this proxy server to handle massive amounts of traffic and bandwidth, so there was no reason why it shouldn’t scale. Zuul was never really the issue at all.
We know that the DDoS protection was not the original culprit of the pattern when the API launched, because not only was that protection not in place yet, but the spectator service endpoints weren’t proxied through the API for the first year or so. We also know that the connection timeout issue wasn’t the original culprit because that was only introduced when we moved Zuul to HermesClient. When we did roll out Zuul with the HermesClient and the bug that didn’t respect the connection timeout, it triggered system wide failures when the DDoS protection rate limited our traffic. We believe that the OS socket and Jetty worker thread changes that we made in our final push to fix the slowness issues actually addressed the pattern of behavior that we had been experiencing for the past couple of years. However, we didn’t notice a change in performance when we first applied the changes because the DDoS protection issue with the spectator service traffic was bottlenecking everything and masking any benefit they provided. Once our IPs were allowlisted, stopping the slow responses, and we load tested again, our traffic ramped up beautifully as it had never done before, since the Jetty and OS setting changes had already been applied. Now, with the bug fix for the connection timeout, we should also be protected from any future incidents of slow responses from proxied services, like the DDoS protection caused.
In addition to the performance improvements, we now have a good understanding of our capacity for the first time. We have determined that we can handle 40K RPM per core CPU-wise. Thus, using the 4 core boxes, we should expect a single Zuul to handle up to 160k RPM. While we allocate 6G of memory to our Jetty process, it hovers around 2.5GB, and is in no way memory bound. We are currently CPU bound for our load, which is a first for us. Our historic behavior when Zuul has shown the slow or unresponsive behavior never involved CPU being pegged, but rather the nefarious socket behavior. We are elated to be in a position that we are bound by CPU.
We learned a lot from a technical standpoint during the process of trying to finally track down and solve the specific issue that initially took Zuul down on the weekend of 4/16, and then launching that into a crusade to solve our Zuul capacity issues once and for all. It took us over a week of emergent unplanned work, but it was well worth it. One amazing part of this entire process was the teamwork it involved. We have people with all different areas of expertise on our team and many contributed to the investigation and fixes. In the end, we have a much more reliable, scalable, and stable edge, putting us in a great position to focus on expanding and improving our feature set and scope.
For more information, check out the rest of this series:
Part I: Goals and Design
Part II: Deep Dive
Part III: Fulfilling Zuul’s Destiny (this article)
Part IV: Transforms