Running Online Services at Riot: Part IV
Welcome back readers to the Running Online Services at Riot blog series. My name is Maxfield Stewart and I’ve written before about how we use containers to build containers on an open source platform. Today’s article will dig into the five key requirements for any micro-service to become a live running application on our container platforms at Riot. Every micro-service at Riot must be:
- Highly portable
- Configured at runtime
- Discoverable
- Knowable
- Able to retrieve secrets
Delivering on all of those requirements necessitates a supporting cast of additional services and tools. Some tools are built for "developers" while some are built for "operators." At Riot, those aren’t job titles, but rather roles that an engineer can switch between. A single engineer might develop a service today and then deploy it tomorrow to get a new feature out the door. I’ll dive into each of these five requirements along with the tools that support them and outline our approach.
If you’re ready to dig into how our micro-service secret sauce is made, read on!
Highly Portable
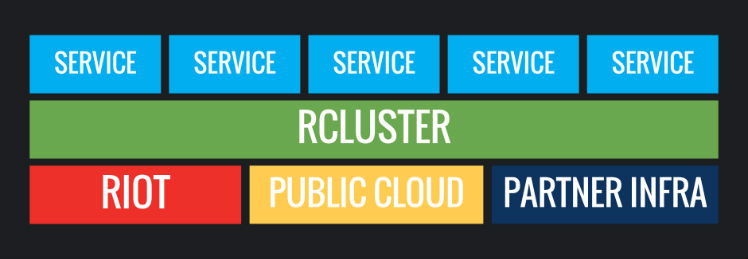
Riot has a massive global deployment footprint. We deploy our services to dozens of datacenters around the world and each of those datacenters can host multiple regions. We want to "build once; ship everywhere," and that means micro-services have to be highly portable.
Making our services portable started with the decision to containerize them. We’ve talked at length about containers and their myriad use cases, as well as valuable technologies like Docker, but putting things in a container won’t solve all of our problems. We still have to deliver those packaged containers to our datacenters around the globe.
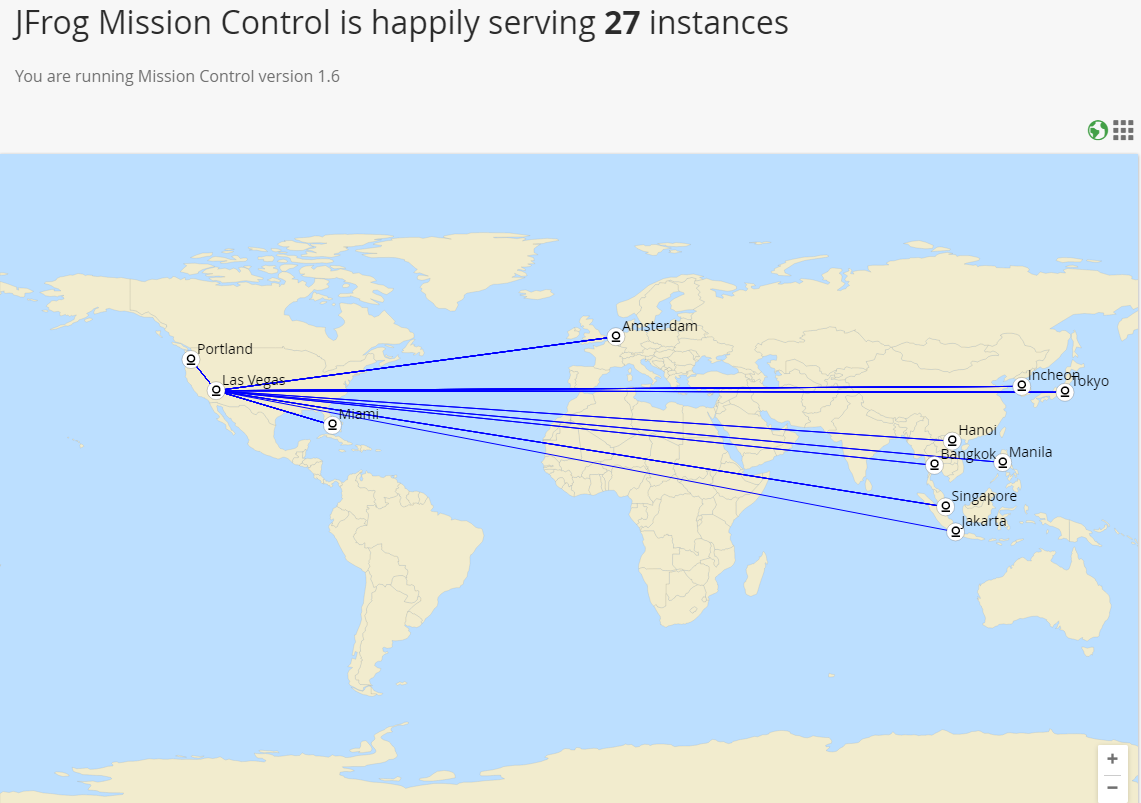
We achieve this goal by hosting our own globally-replicated docker registry, leveraging the power and capability of JFrog’s Artifactory. The diagram below shows the production lifecycle of a built container image:
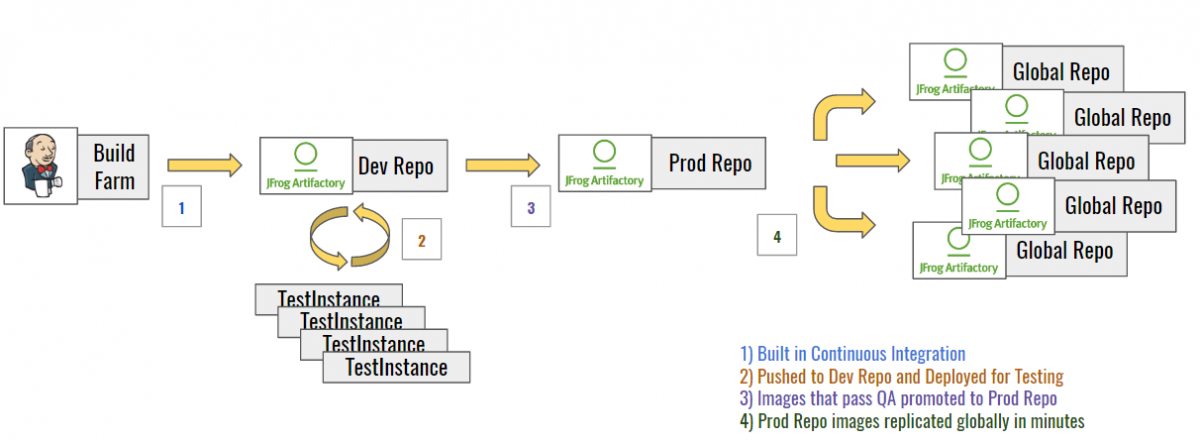
We’ve talked about building software at Riot before in our tech blogs. We clock in over 1.25 million builds per year. Some portion of that number is micro-services built as Docker images destined for production. Once emitted from our continuous delivery process, they’re parked in an internal Docker registry. Once they’re ready for production, they’re flagged as “promoted” and moved to a replication repo, which immediately begins seeding the Docker image to our datacenters.
Because these Docker images are built on reusable layers, they can replicate around the world in minutes. They tend to be very small as only the bits that have changed move. You can read more about Docker’s image layer capabilities here.
Configured at Runtime
We’re currently running over 10,000 containers in production at Riot. Any one micro-service may consist of several containers. All of those running containers are much like newborn infant apps, blindly emerging into the glorious light of their production environment. They need to establish where they are and how to configure themselves as a result of that information quickly. In a traditional deployment system you might include a configuration payload with your application and use tools like Chef or Puppet to maintain convergence of that configuration over time. But to maintain portability our applications must be deployable and equipped to operate in any environment at runtime, no muss, no fuss.
This is where configuration as a service comes in. We wanted to use our own application scoping scheme, and after analyzing many open source solutions we realized that writing our own configuration service gave us the most flexibility.
Solving for a naming scheme turned out to be relatively simple. When our applications start up, they know who they are and where they are because our scheduler informs them via simple environment variable injection.
Let’s take a look at our scoping scheme, which breaks into two macro parts:

The environment scope breaks into three parts and the application scope breaks into two like so:
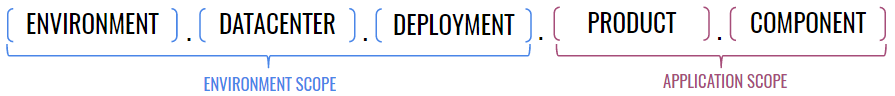
I’ll use a simple little tool we’ve nicknamed "MyApp" to demonstrate. MyApp is deployed to be available to all Riot services inside our second Vegas datacenter. It’s composed of just a server component. It might look like this:
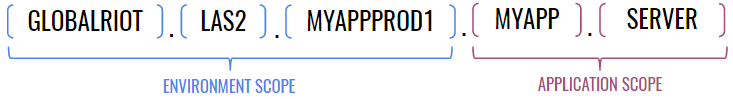
That environment component called "myappprod1" is important. I might also deploy a QA version (myappqa1) or development version (myappdev1) of my app to the same cluster. I might even run two production versions for different reasons. The scoping scheme gives us the power to create environments inside a cluster.
For this to work as a configuration lookup scheme, we have to push the data to the configuration service using our scopes. For example, if I wanted to push data that applies to all of the applications I’ve deployed to "globalriot.las2.myappprod1," I’d push configuration data to:

When "Myapp" spins up and identifies itself, it matches the first three parts of the scope and acquires the configuration data for the wildcards. If I wanted a specific configuration to apply to a specific instance I’d push that data to:

Anything that identified itself with that complete scope would get the data. The data itself is really just a set of properties. Just simple key/value pairs that might be anything. Here’s an example of some data for a targeted scope:
http.ProxyType=http
http.ListenPort=80
http.DomainNames=myapp.somedomain.io
Configuration data can also updated in real time. Imagine a rate limiting property:
ratelimit.txsec=1000I could push a new ratelimit.txsec value and the application would dynamically adjust after checking for configuration in real time. This provides us with powerful capabilities to affect live services. There was a time when fixing League of Legends champion data required a full redeploy of the game. Now we can push that data to our configuration as a service and our game servers pick it up on game start and automatically apply tweaks to fix balance issues, enable/disable a champion, etc - all without disappointing players with down time.
Discoverable
If we have a configuration service, which itself is just a micro-service, how do applications know where to find it when they launch? If one micro-service needs to communicate with other micro-services, how does it find them? This is the chicken/egg problem of discovery.
Our micro-services don’t need domain names. In fact, they could have a random IP any time they start anywhere in a cluster. We chose to solve this with a discovery service or "one service to rule them all." Our discovery service lives at a known domain name and new services know where to look for it.

When we first started on this journey, we were inspired by Netflix’s Eureka solution to this problem. In fact our first deployments were fresh Eureka instances. Eureka is excellent, but over time we started to feel we needed something that had a bit more native understanding of our operating environments.
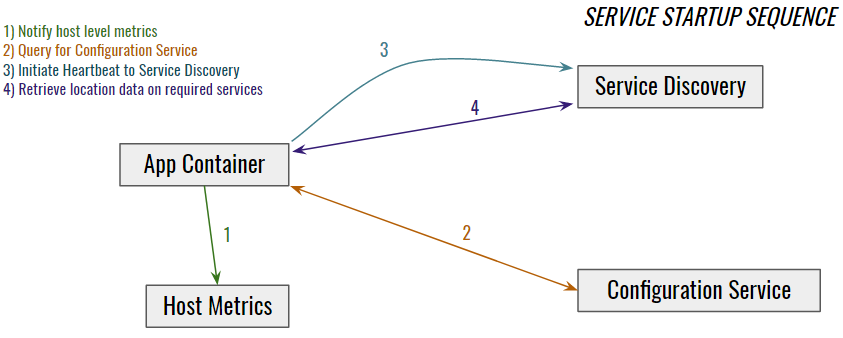
After a new application starts, it seeks out the discovery service to find out where the configuration service lives, a process I detail below. It’s important that the app configures itself before executing the next step: registering itself in Discovery. This allows other services to find and query the new service as well as learn about the contracts it serves. Here’s an example of how one of our metrics services reports for one of our QA environments:
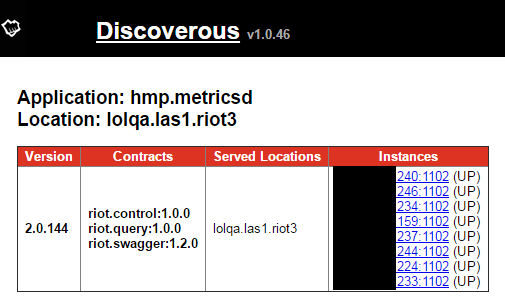
Once the application has found discovery, found the configuration service, and reported itself, it can also proceed to use discovery to find other services it needs to communicate with.
This all sounds pretty simple, but there are a few complicated cases that we need to keep in mind. For example, if a service shuts down, we have to de-register it or risk lying to requesting services about which service is listening at which IP and port. If a service’s IP changes, we have to update it or risk routing traffic to the wrong location.
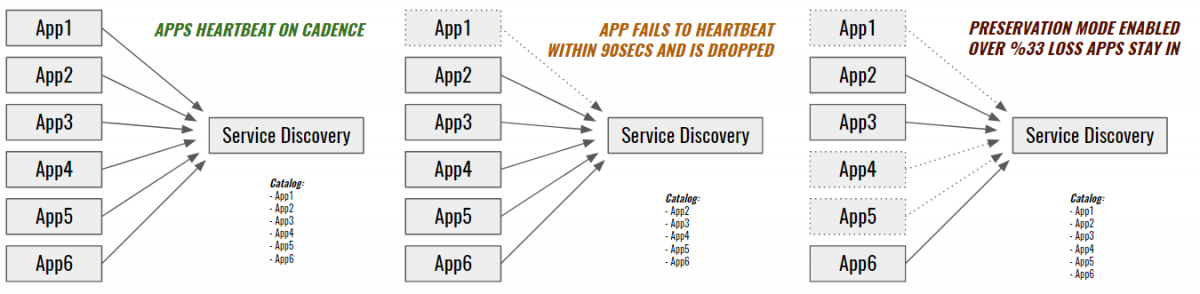
We handle these cases with a simple heartbeat pattern. Services that fail to call back in the allotted time are assumed M.I.A. and dropped from discovery. However, things may not be so straightforward in a production environment. If something goes terribly wrong in the datacenter, the system needs a basic level of awareness to react appropriately. If discovery notices that a large number of its registered clients stop heartbeating, it can assert that there is some kind of mass network or communication failure and fall into "preservation" mode. In preservation mode, discovery retains its data and immediately pages an operator, thus helping to protect us from various registration storms or the ever popular "network blip."
Knowable
All micro-services at Riot emit a health status report on a known endpoint. These emissions could look like "Healthy," "Degraded," "Failed," etc. Even simple reports allow us to query our discovery service and check the health of all services using basic REST calls.
But that’s not enough. What happens if a service fails to register? Or what if a service de-registers because it crashed? How do we know if it should be up or down if it’s not in discovery?
That’s where our alerting and metrics system comes in.
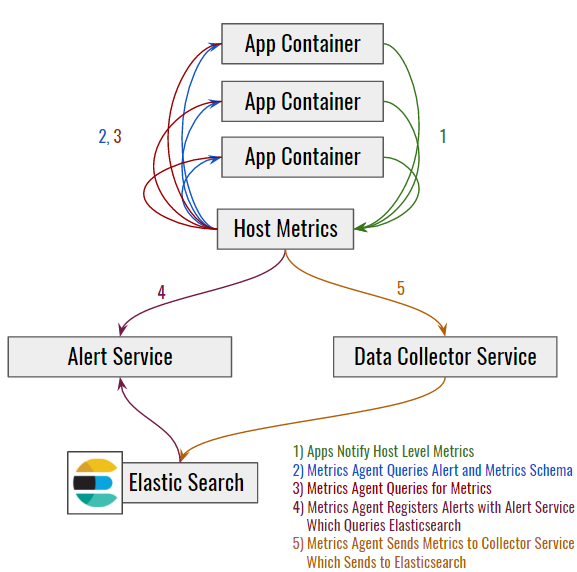
The metrics system can query an app for its metrics payload and absorb that data into the metrics pipeline, retrieving and then pushing the metrics to our data collectors located in every datacenter. Data is then forwarded to an Elasticsearch storage engine, where registered watchers assist in triggering alerts.
Applications maintain endpoints that announce relevant alerts. The alerting service registers these and then monitors for state changes in metrics via the monitoring service. If an application’s status changes from "Healthy" to "Degraded," and the app has registered an alert on that state, the alerting service will notify the registered contact point (via paging, email, etc).
How does the metrics system know where the collector is? Service discovery! Creative developers can even change metrics and alerts in real time by setting which metrics a service emits, their interval, or the service’s alert configuration through the configuration service. Is an alert being too noisy? Have you noticed a particular alert that always causes a false alarm? Push a configuration change to your application scope and tell it to de-register the alert.
The aggregated metrics can then be pooled into a data warehouse. In our case, we’re moving our data to something we call the Real Time Data Pipeline, which is backed by Elasticsearch and hosted by our Data Products and Solutions team at Riot. Once the data is in the pipeline, we can build dashboards with ease. Remember, all of our apps report their naming scopes and their metrics data so we can easily query for metrics from a particular app in a particular datacenter in a particular region or with a particular name.
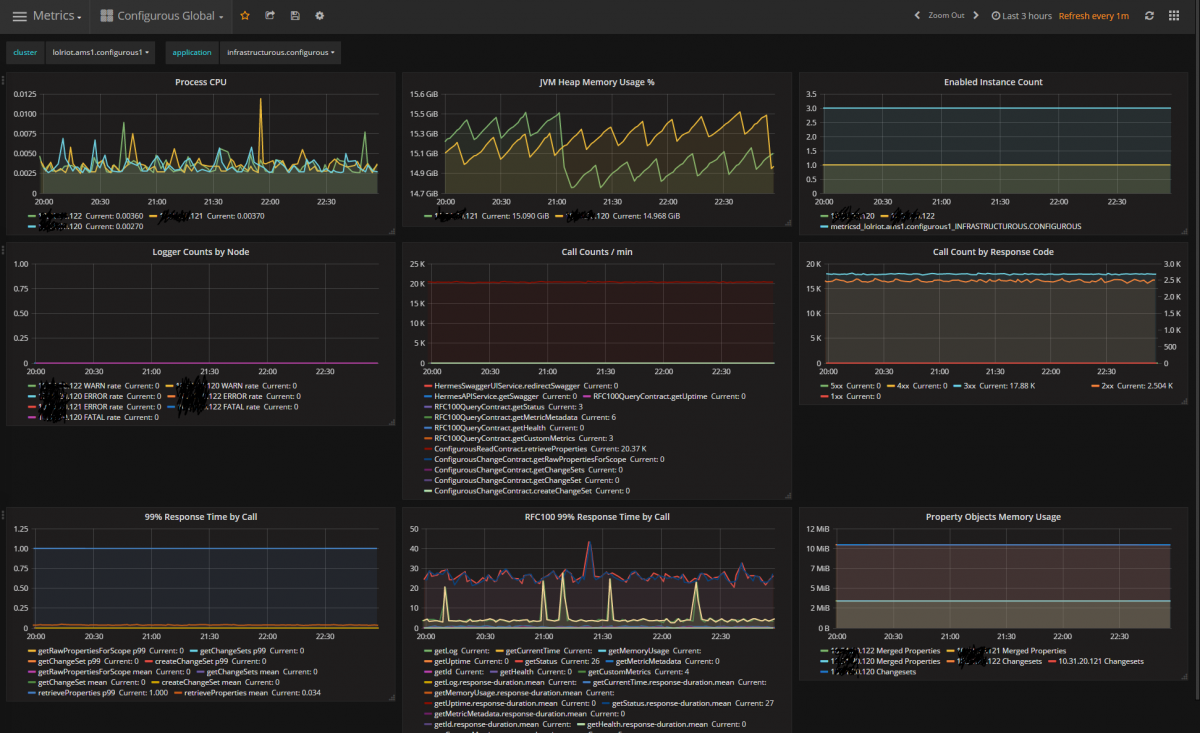
This is a capture of the metrics from our configuration service. It’s not every metric, but it’s a nice sample. You can see its CPU load (really light) and that it receives around 20,000 requests a minute. This particular instance is from our Amsterdam datacenter - its "cluster" is "lolriot.ams1.configurous1" (the deployment scope) and the application is "infrastructurous.configurous" (its application scope).
We can build alerts off these metrics if we want. For example, using the Enabled Instance Count, we could create an alert that pages someone if we see less than the expected "3" instances.
With the small upfront cost of properly registering their applications in Service Discovery and Configuration, Riot developers get this kind of reporting for free.
Able to Retrieve Secrets
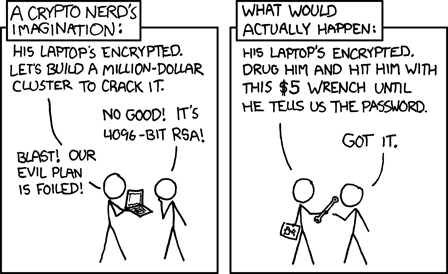
So far I’ve conveniently sidestepped a critical issue: security. Communicating securely is a necessity of any highly portable, dynamically configurable micro-service system. SSL certs for HTTPS traffic or API authentication tokens must be locked down. We want this data in our configuration service so it’s easily accessible, but we certainly wouldn’t be doing ourselves any favors by storing it in plain text. So what do we do?
What if we encrypt and store that data in our configuration service? We’d need a way to decrypt it once we retrieved it and a way to ensure that the app retrieving it is the only one with the decryption key. Thus enters the final piece of our operable puzzle: secrets management.
For this requirement, we chose to create a service wrapper around HashiCorps’ excellent Vault service. Vault actually does a whole lot more than we need it to, as we really only want to store the decryption key so our services can retrieve it and decrypt their data. So our service wrapper basically enables REST endpoints for that purpose.
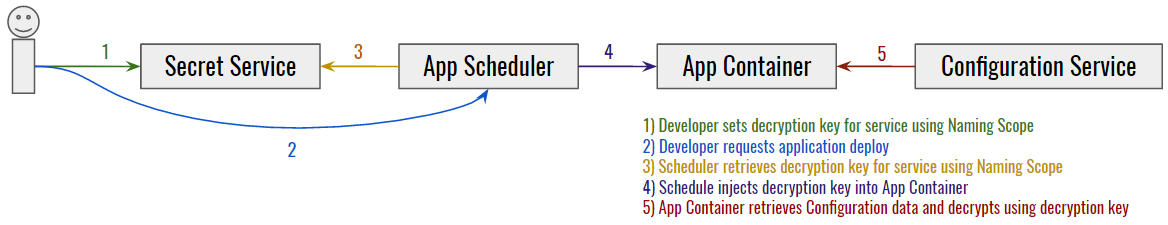
To use this is simple in theory. Developers place service-specific decryption keys into the secret service using the application naming scope. Our container scheduler, Admiral, then injects keys into application containers when they start (looking them up by naming scope). Once an application container has its decryption key, it can decrypt configuration properties it has retrieved from the configuration service. The owner of the service’s configuration needs to use the encryption key to encrypt the data before pushing it to the configuration store.
The details of this flow and how it works are beyond the scope of this blog post, but the workflow is what’s critical. With this system in place, services can now be highly portable, dynamically configured, self-aware, knowable, and discoverable while also handling secure data bits when necessary.
Up Next: Developer Ecosystem
We’ve talked about all the services that behave like bot-lane supports to the services running in our production clusters, but there’s a whole lot more to our ecosystem. Afterall, what good would all of this do if our developers couldn’t use it effectively? To aid in leveraging this system, we’ve created a number of web and CLI tools. If what I just talked about was the production ecosystem, we still need to discuss the developer ecosystem. But that’s a story for the next article! For now I’ll leave you with a bit of a teaser. This is a screenshot from one of our web app widgets that we use to access the tools within our ecosystem and see a lot of the data I just presented to you:
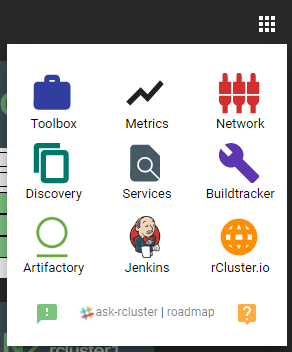
If you’re curious what some of those tools are, tune in next time!
For more information, check out the rest of this series:
Part I: Introduction
Part II: Scheduling
Part III: Networking with OpenContrail and Docker
Part III: Part Deux: Networking with OpenContrail and Docker
Part IV: Dynamic Applications - Micro-Service Ecosystem (this article)
Part V: Dynamic Applications - Developer Ecosystem
Part VI: Products, Not Services